Content protected by copyright.
C-Virus 2020
Reported Cases of COVID-19 in Yavapai County, AZ
APRIL 8, 2020: No statistically significant slowing is apparent as of April 8, 2020. Leadership at State and Local levels have been slow to implement changes to slow the spread of the virus. We are paying the price for having "leaders" who lead from behind.
APRIL 12, 2020: Today is Easter, or Resurrection Sunday. It is fitting that today there is some evidence of flattening of the curve of total cases reported in Yavapai County. A three day moving average curve has been added because that is the way some authorities are viewing the information. My hope is that the curves flatten beginning this week .If so, that may signal the beginning of the end of this threat in our county..
APRIL 13, 2020: Two new cases today.
APRIL 14, 2020: Three new cases today
APRIL 15, 2020: One new case today.
APRIL 16, 2020: County reported an error but did not say when it occurred. Therefore the downturn shown may have occurred earlier. Here is what was reported. "April 16th Morning Update - Yavapai County Epidemiologist finds Duplicate Reporting of Cases."
The number of cases was given today as 69. The number of recovered individuals went up from 2 to 5.
APRIL 17, 2020: Two new cases reported this morning. Recovered stands at 5.
APRIL 18, 2020: Two more today.
APRIL 19, 2020: No new cases today.
I've added a second chart today. MACD is one way to show change in the rate of change in what ever you are tracking. It is often used by stock investors to assist in determining a change in price trends. I this case the intent is to graphically show change in trend rate of new cases o Covid-19 in Yavapai county.
APRIL 20, 2020: The county reports one less case today. Is that another error?
APRIL 21, 2020: More cases again today and one more recovery.
APRIL 22, 2020: One more case today.
APRIL 23, 2020: Curves are accelerating upwards. 76 Cases. This is bad for us.
APRIL 24, 2020: I didn't update this page.
April 25. 2020: The case count was adjusted down from 76 to 75 yesterday for reasons I didn't understand.
APRIL 26, 2020: One case today.
APRIL 27, 2020: No new cases today. One more recovery.
APRIL 28, 2020: Two more cases as the pace of testing has now increased in our area. Sadly, there is another death.
APRIL 29, 2020: Additional testing seems to show an increase in cases. This implies the previous cases understated the truth, that is, there were more cases in Yavapai County than authorities reported. We just don't know how many and likely we never will know.
APRIL 30, 2020: Up again today. The upward trend is accelerating. Positive report is the increase to 11 in recoveries.
MAY 1, 2020: Up to 86 cases today. Authorities said on radio today that the curve has flattened for Yavapai County. Look at the curves below and see if you agree. MACD and percent daily change charts clearly shows the rate of new cases has NOT flattened.
MAY 2, 2020: Up to 89. Looks like curve is a long way from flattening.
May 3, 2020: Up to 91.
May 4, 2020: Cases = 128 now. Many new cases at Mingus Mountain Academy but we were not told how many so it is not possible to know how many other cases were new today.
MAY 5, 2020: 139 cases, up 11 today.
MAY 6, 2020: 153 cases, up 14 today.
May 7, 2020: 172 cases, up 19 today. Recoverries 12, up 1.
May 8, 2020: 175 cases, up 3 today. Recoveries 13, up 1. Deaths 4, up 2.
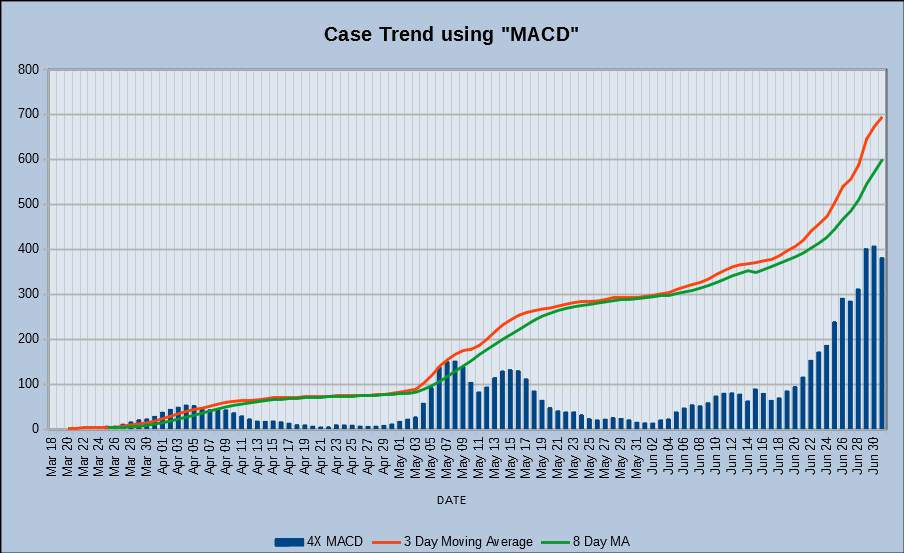
The Case Trend using MACD Chart
The Case Trend using MACD.chart is probable the most useful chart on this page for detecting changes in trend. The difference between a 3 day moving average and an 8 day moving average is plotted as bars. The magnitude of the bars is 4 times the actual to make small changes more easily seen. Example: When the 3 and 8 day moving average curves have the same slope, the bar heights will move towards zero. What we want to see is a long term trend in which both the red and green curves flatten and the difference between them goes to zero and stays there.. (NOTE: This chart is an adaption of the MACD chart used in investing. It does not use the same mathematical formulas. It does exhibit some of the same features making it another useful way to look at trends in data.)
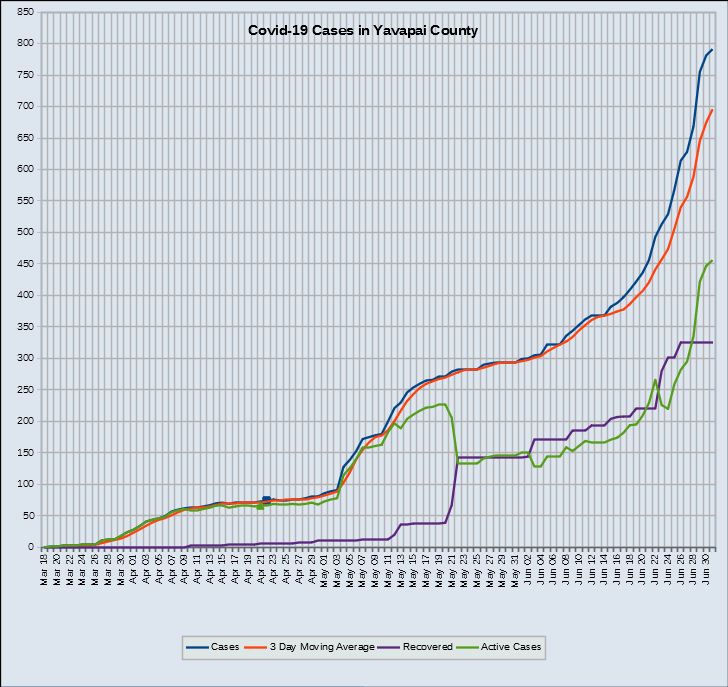
Covid-19 Cases in Yavapai County Chart
This chart plots the total number of Cases. It also uses a 3 Day moving Average to smooth out brief changes. Recovered cases are plotted in purple. Deaths are charted in a separate chart. Active cases, plotted in green, equals total cases less recovered cases and deaths. Someday the active cases value should return to zero.
May 9, 2020: Cases 178 up 3, Recoveries 13, up 0, Deaths 4, up 0,
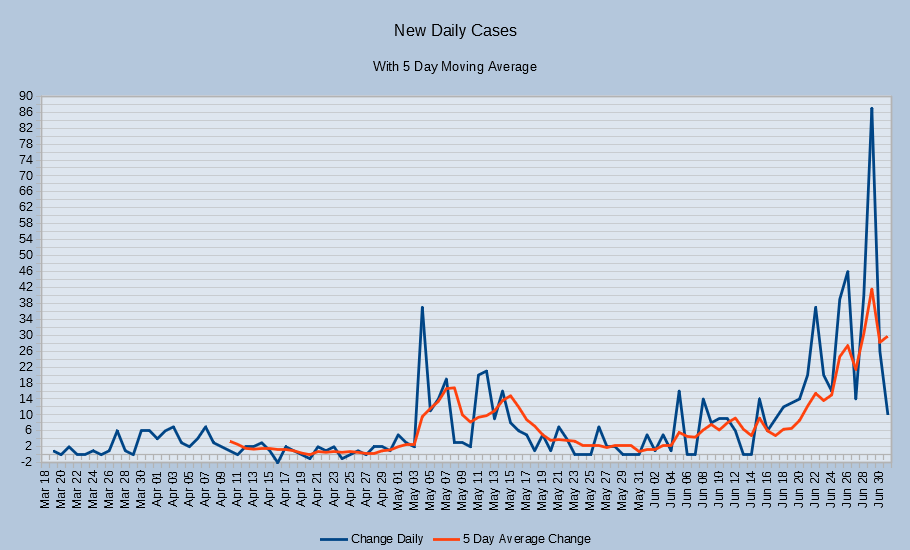
Daily Change in Cases in Yavapai County
The Daily Change in Cases in Yavapai County simply plots the change in new cases compared to the previous day's new cases. When this curve falls to zero and stays there we can celebrate. The county has stopped reporting new cases on weekends. Therefore the (0) cases reported on weekends is misleading.
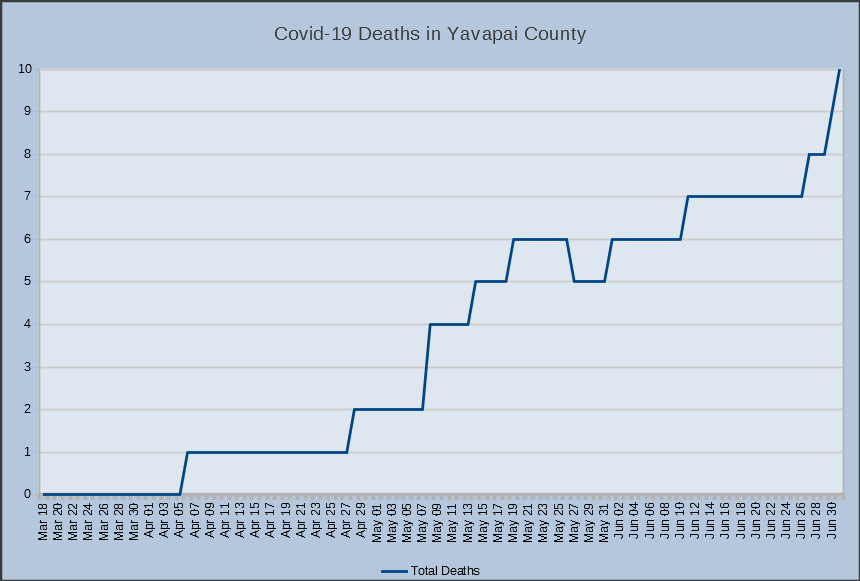
Covid-19 Deaths in Yavapai County
The Covid-19 Deaths in Yavapai County chart plots the deaths as occurring on the day they are reported, not the actual date of death. See June 27 note at top of page for more information..
May 10, 2020: Cases 180, up 2, Recoveries 13, up 0, Deaths 4, up 0.
May 11, 2020: Cases 200, up 20, Recoveries 13. up 0, Deaths 4, up 0.
May 12. 2020: Cases 221, up 21, Recoveries 20, up 7, Deaths 4, up 0.
NOTES:
1. It is good to see Recoveries going up.
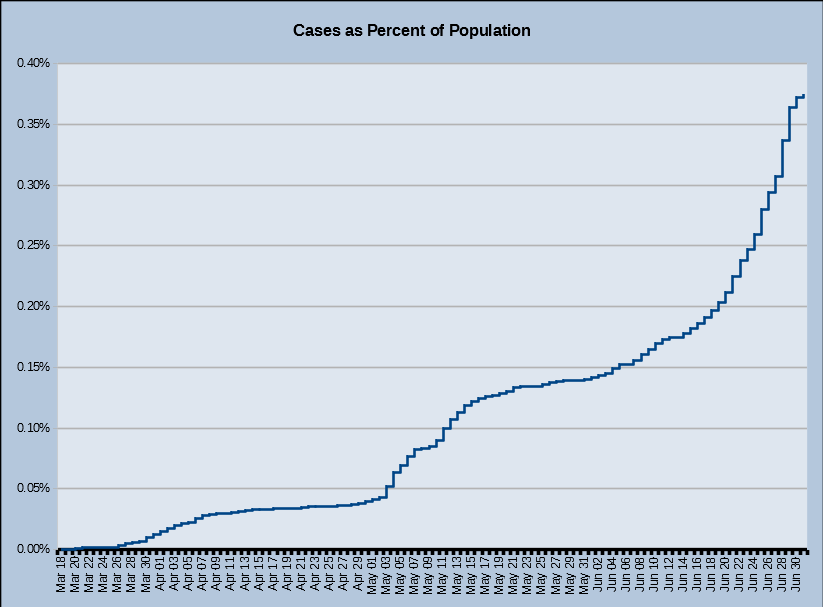
2. I've added a new chart, Cases as Percent of Population. This is the number rarely, if ever, given in the news. It is placed first because it communicates the true situation better than "raw" numbers that we are given in the news.
July 1, 2020: Cases 791, up 10, Recoveries 331 up 6, Deaths 10 up 1
This page began as entries into my "Blog" page My intent was to plot the reported new cases of Covid-19, or as some have called it, the Chinese Virus which recognizes its source much as the name "Spanish Flu" tells us the origins of that pandemic. As a kid I had the German Measles, hmmm.
The entries into the Blog page were intended to make trends more easily seen. Charts can be a good tool for that purpose so I introduced a chart. Then more charts were introduced. Now there are enough charts with one BIG exception. I haven't see a chart from county health that plots the Percent of Population infected by the flu for the past season, If we had that we could use it to gain perspective. All of the chatter is about Corona virus. We don't have data for the flue to which we could make meaningful comparisons. If I can find that I'll add it to this page. It must exist somewhere. If you know please let me know. The only information I have now is the following:
This was reported March 13, 2020 by Yavapai County. Deaths in AZ and Yavapai county are not mentioned.
"CDC estimates there have been at least 36 million flu illnesses, 370,000 hospitalizations and 22,000 deaths from flu so far this season.
Arizona is in the midst of a busy flu season already, and it is important people stay informed about how to keep both the flu and COVID-19 from spreading. That means regular hand-washing, getting a flu shot and staying home from work or school when sick. There have been 28,710 confirmed cases of the flu in Arizona, and 540 confirmed cases of the flu in Yavapai County. There are no cases of COVID-19 in Yavapai County."
The Blog page was growing too long and straying from its original purpose. The C-Virus page was created solely for pandemic related information so that the Blog page can return to hobby and other personal items.
May 13, 2020: Cases 230, up 9, Recoveries 37, up 17, Deaths 4, up 0
May 14, 2020: Cases 246, up 16, Recoveries 37, up 0, Deaths 5, up 1
May 15, 2020: Cases 259, up 13, Recoveries 37, up 0, Deaths 5, up 0
May 16, 2020: Cases 260, up 1, Recoveries 37, up 0, Deaths 5, up 0
May 17, 2020: Cases 265. up 5, Recoveries 38, up 1, Deaths 5, up 0
May 18, 2020: Cases 266, up 1, Recoveries, 38, up 0, Deaths 5, up 0
May 19, 2020: Cases 271, up 5, Recoveries, 38, up 0, Deaths 6, up 1
May 20, 2020: Cases 272, up 1, Recoveries, 38, up 0, Deaths, 6, up 0
May 21, 2020: Cases 279, up 7, Recoveries 67, up 29, Deaths 6, up 0
May 22, 2020: Cases 283, up 4, Recoveries 143, up 76, Deaths 6, up 0
May 23, 2020: No report from county today. May 24, 25, no new reports.
May 27, 2020: Cases 292, up 2, Recoveries 143, up 0, Deaths 5, Down 1. I saw no reason given for the drop.
May 26, 2020: Cases 290, up 7, Recoveries 143, up 0, Deaths 6 up 0**
** The county did not update information May 23, 24, 25. Therefore take care when reading the charts. I really don't know the days cases went up.
May 28, 2020: Cases 294, up 2, Recoveries 143, up 0, Deaths 5, up 0.
May 29, 2020: Cases 294, up 0, Recoveries, up 0, Deaths, up 0. NOTE: NO increase in cases today.
June 1, 2020: Cases 299. up 5, Recoveries 143 up 0, Deaths 6, up 1
It appears the county no longer updates their website on weekends. Therefore take care when reading the charts. I really don't know the days on which cases reported on Monday went up.
June 2, 2020: Cases 302 up 3, Recoveries 143 up 0, Deaths 6, up 0
June 3, 2020: Cases 305 up 3, Recoveries 171 up 28, Deaths 6 up 0
NOTE, I added a link on Home page to state information. I don't have good feelings about the C-virus situation in either the state or our county at this time.
June 4, 2020: Cases 306 up 1, Recoveries 171 up 0, Deaths 6 up 0
June 5, 2020: Cases 322 up 16, Recoveries 171 up 0, Deaths 6 up 0
NOTE: As of Saturday health officials and politicians say increases are not a problem. I'll let the reader decide.
June 6,7,8: Cases 336 up 14 this weekend, Recoveries 171 up 0, Deaths 6 up 0
June 9, 2020: Cases 344 up 8, Recoveries 185 up 14, Deaths 6 up 0
June 10, 2020: Cases 353 up 9, Recoveries 186 up 1, Deaths 6 up 0
June 11, 2020: Cases 362 up 9, Recoveries 186 up 0, Deaths 7 up 1
June 12, 2020: Cases 368 up 6, Recoveries 194 up 8, Deaths 7 up 0
June 13, 14, 15, 2020: Cases 382 up 14, Recoveries 204 up 10, Deaths 7 up 0. I didn't have data for Saturday or Sunday.
June 16, 2020: Cases 388 up 6, Recoveries 207 up 3, Deaths 7 up 0
June 17, 2020: Cases 397 up 9, Recoveries 208 up 1, Deaths 7 up 0
June 18. 2020: Cases 409 up 12, Recoveries 208 up 1, Deaths 7 up 0
June 19, 2020: Cases 422 up 13, Recoveries 220 up 12, Deaths 7 up 0
It appears the county no longer updates their website on weekends. Therefore I found other reports. The news is NOT good. At the rate of increase in new cases the intensive care hospital beds will soon be over flowing in AZ. In fact, per www.covidusa.net ICU BEDS CAPACITY MAY ALREADY BE OVER 100% in AZ. C-virus case rate is accelerating at a pace that is alarming to me.
June 20, 21, 2020 week end update. Cases 456 up 34, Recoveries 220 up 0, Deaths 7 up 0
June 22. 2020: Cases 493 up 37, Recoveries 220 up 0, Deaths 7, up 0
June 23. 2020: Cases 513 up 20, Recoveries 280 up 60, Deaths 7, up 0
June 24. 2020: Cases 529 up 16, Recoveries 302 up 22, Deaths 7, up 0
June 25. 2020: Cases 568 up 39, Recoveries 302 up 0, Deaths 7, up 0
June 26, 2020: Cases 614 up 46, Recoveries 325. up 23. Deaths 7. up 0
JUNE 27 SPECIAL NOTICE:
1 June 26 daily case number was in error. It was high by 10. That has been corrected in the charts and text
2. On weekends I must use data from the state website which often differs from the county website but it is the best I can do.
3. The state has changed the way they report deaths. I've added their notification here.
"As our federal partners have updated guidance for identifying COVID-19 deaths, ADHS has enhanced our processes to match. This change may cause the number of new deaths reported on our dashboard to increase more than expected for a few days. Deaths are shown on the bar chart of the COVID-19 deaths section of the dashboard using the date of death, not the day reported. New deaths on the summary section of the dashboard are displayed by the day reported to ADHS."
4. My concern continues to be that hospital resources will soon be at 100% utilization given the rate at whice cases are going up . Let's all do our part to slow the spread by wearing masks in public plus following the other guidelines. No large groups etc.
June 27, 2020: Cases 628 up 14. Recoveries 325 up 0, Deaths 8, up 1
June 28, 2020: Cases 668 up 40, Recoveries 325 up 0, Deaths 8, up 0
JUNE 29 (Monday) NOTE:
I've switched from the County website to the state website and now use the Dashboard to get my information. The county had stopped weekend updates. The charts are more accurate if daily updates are done. I will continue to use the state website as a source so long as it seems to work out better.
I heard on the radio that some hospitals are now at 100% capacity for COVID patients making it necessary that patients be moved to other hospitals. This is what the charts told me would happen at about this time. I don't understand the way some people, businesses, and organizations continue to see this situation as "business as usual" putting others unnecessarily at increased risk of getting good care.
June 29, 2020: Cases 755 up 87, Recoveries 325 up 0, Deaths 8, up 0. Hospitals are filling up; some are full.
June 30, 2020: Cases 781 up 26, Recoveries 325 up 0 Deaths 9 up 1